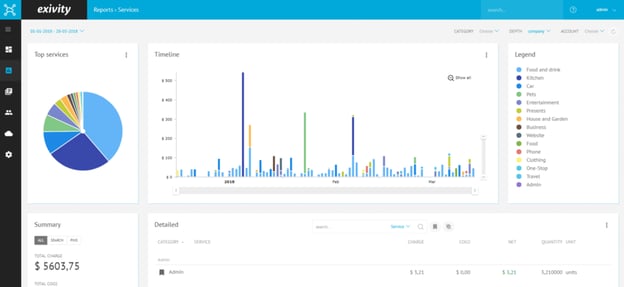
We're excited to announce that version 3.26.0 of Exivity includes several enhancements to our reporting capabilities, specifically with the introduction of linear and aggregated moving average trendlines. These new features open up several practical applications for our users.
Budget Forecasting Made Easy
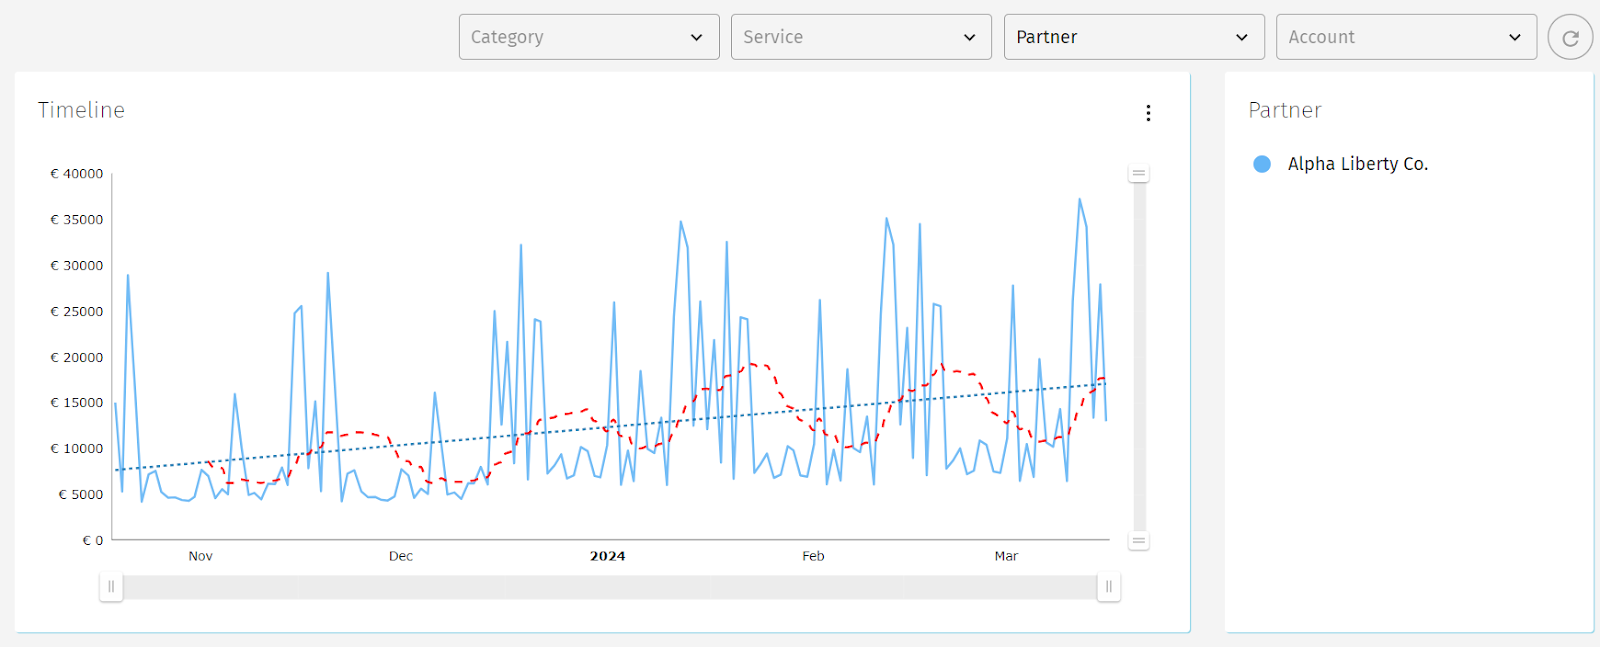
Planning your cloud budget just got easier. With the latest update, Exivity now provides trendlines directly within your reports based on your selected filters. For FinOps administrators tasked with budget estimations, the linear trendline will prove invaluable. It offers a straightforward way to analyze historical trends and project future cloud costs for projects or departments. This tool is always at your disposal, ready to assist in financial planning with precision and ease.
Optimize Your Business Model
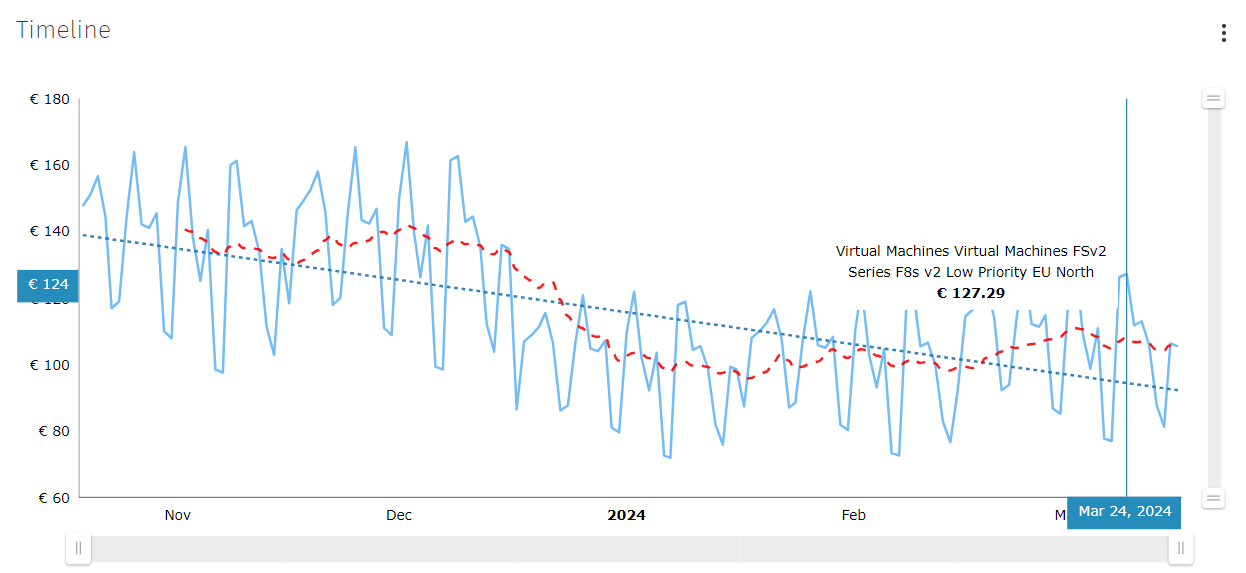
In the dynamic landscape of hybrid multi-cloud environments, understanding usage trends is more crucial than ever, especially for businesses managing and reselling services from major providers like Azure, AWS, and GCP. The new moving average trendlines in Exivity help clarify these trends, enabling more informed decisions about pricing and service scaling. Here’s how Exivity integrates moving averages for comprehensive monthly and daily data analysis:
- Monthly Moving Average:
- Fraction (Weight): 20% - This setting emphasizes recent data, helping identify emerging trends in service usage, essential for adapting your pricing strategies.
- Minimum Period: 3 months - Ensures that the moving average is reliable by waiting until three months of data are available.
- Maximum Period: 12 months - Focuses on the past year to help observe long-term trends, crucial for yearly strategic planning.
- Daily Moving Average:
- Fraction (Weight): 10% - Targets the most recent ten days of data, crucial for rapid response to changes.
- Minimum Period: 5 days - Provides a stable base for daily averages, avoiding the noise of daily fluctuations.
- Maximum Period: 30 days - Offers a comprehensive view of daily operations without the distraction of short-term variability.
These enhancements are particularly beneficial for cloud service resellers and enterprise FinOps teams. The addition of linear and moving average trendlines in Exivity not only aids in tracking and analyzing customer and service usage patterns but also supports dynamic pricing models and resource allocation based on actual usage. Whether you’re adjusting for seasonal demand or launching new promotional campaigns, these new analytics features provide a robust framework for making data-driven decisions.
Stay ahead of the curve with Exivity’s latest features, designed to give you full financial insight into any IT resource.